Australia may need up to 300,000 more construction workers by 2027 — and Queensland is at the centre of the shortfall
Why This Matters
The gap between when Australians sign a building contract and when they move in has increased by around 50% since 2019 [2][8]. In Queensland, a combination of trade shortages, falling productivity, and a $7.1 billion Olympic venue program is likely to place further pressure on build times [3][4][11].
About This Study
This analysis draws on data from the Australian Bureau of Statistics, Infrastructure Australia, the Queensland Productivity Commission, and Construction Skills Queensland to map how long construction takes across each state — and to explore the key factors contributing to delays [1][3][4][5].
Methodology
Completion time data was extracted from the ABS Building Activity series (September 2025 release), which tracks the average number of quarters between approval and completion for detached houses, townhouses, and apartments in each state [1]. Workforce shortfall projections come from Infrastructure Australia’s 2025 Market Capacity Report (November 2025), which models supply and demand across the national five-year Major Public Infrastructure Pipeline [3]. Queensland-specific productivity data is drawn from the Queensland Productivity Commission’s final report on construction productivity (January 2026) [4]. Construction cost forecasts are based on Rider Levett Bucknall’s Q4 2025 tender price index [7]. All data was collected between 8 and 10 April 2026.
Key findings
Australia’s construction workforce is short by an estimated 141,000 workers, and that number is projected to reach around 300,000 by mid-2027, according to Infrastructure Australia [3]. The country’s five-year infrastructure pipeline has grown to $242 billion — its highest level on record — putting further pressure on available labour [3].
The result: new houses that took an average of around 6 months and 3 weeks to build before the pandemic now take around 9 months and 4 weeks [2][8]. That’s roughly a 50% increase in completion times nationally. Apartments take significantly longer — averaging around 32.9 months from approval to completion, or close to three years [1].
How build times compare, state by state
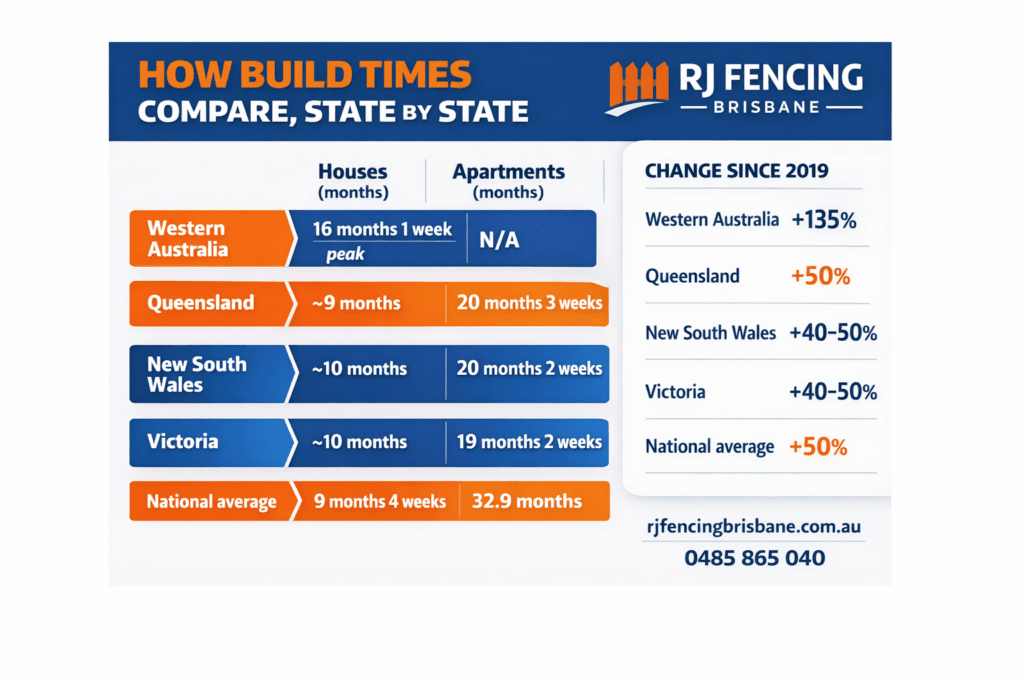
| State | Houses (months) | Apartments (months) | Change since 2019 |
| Western Australia | 16 months 1 week (peak) | N/A — small sample | +135% (worst blow-out) |
| Queensland | ~9 months | 20 months 3 weeks | +50% (national avg) |
| New South Wales | ~10 months | 20 months 2 weeks | +40-50% |
| Victoria | ~10 months | 19 months 2 weeks | +40-50% |
| National average | 9 months 4 weeks | 32.9 months | +50% |
Note: Completion times are based on ABS data measuring the period from approval to completion. Pre-pandemic benchmarks for house build times are supplemented using industry data (Master Builders Australia), which measures contract-to-completion timelines. Figures are indicative and may not be directly comparable.
Western Australia recorded the most dramatic increase of any state. At its peak in March 2024, the average WA house took around 16 months and 1 week from approval to completion — up from around 6 months and 4 weeks before COVID [1][8]. That’s roughly a 135% increase. Build times have since started to ease, but they remain well above pre-pandemic levels [2].
Queensland’s headline numbers look moderate on paper — roughly 9 months for houses [2][8]. But the state’s construction sector has a well-documented productivity problem that the raw completion time figures don’t fully capture [4][14].
Queensland: the productivity collapse behind the numbers
The Queensland Productivity Commission published its final report in January 2026, and the picture is stark. Construction productivity in the state has fallen by around 9% since 2018 [4]. Had it remained steady, Queensland could have delivered an estimated 77,000 additional dwellings over that period [4].
Some Queensland construction sites now average as few as 2.5 productive days per week. Industry analysis suggests the state recorded around 184 construction working days in 2024 — compared to Victoria’s 226 [5]. The QPC attributes the decline to two main factors: increasing regulatory burdens across land use, building activity, and labour markets; and sub-optimal procurement practices linked to the state government’s expanding capital works program [4].
Construction sector productivity in Queensland is only around 5% higher than it was in 1994–95, while productivity across the broader market economy has grown by roughly 65% over the same period [4].
The Olympics factor: $7.1 billion competing for the same trades
Brisbane’s 2032 Olympic and Paralympic Games have triggered a $7.1 billion venue infrastructure program covering 17 new and upgraded venues, including a 63,000-seat stadium at Victoria Park, the National Aquatic Centre, and facilities at Yeerongpilly, Sunshine Coast, and Moreton Bay [11].
Construction Skills Queensland forecasts the state’s construction pipeline will grow from $53 billion in 2024–25 to a peak of $77 billion in 2026–27 [5]. At that peak, Queensland is expected to need an estimated 50,000 additional construction workers [5]. The trades in highest demand — carpentry, plumbing, electrical, and concreting — are the same trades required for residential homebuilding.
Infrastructure Australia’s national figures reflect a similar trend at a larger scale. Peak workforce demand is projected to occur around mid-2027, reaching approximately 521,000 workers — against a current workforce of around 204,000 [3]. The shortfall is projected to be close to 300,000 [3].
Builder insolvencies: 3,567 in Queensland alone
The workforce shortage isn’t the only risk facing homeowners who’ve signed a building contract. Queensland recorded 3,567 insolvency appointments in the construction sector in 2024–25, according to the QBCC’s annual report [6]. Nationally, more than 5,000 construction companies collapsed in the 24 months to May 2025 [9].
The pattern is well documented: builders entered fixed-price contracts during the housing boom, then faced sharp increases in material costs and trade rates post-COVID, putting pressure on margins. The AICM reported that construction insolvencies reached a decade high in 2024 [10].
The housing maths don’t add up
Brisbane’s rental vacancy rate fell to 0.9% in January 2026, making it the tightest capital city rental market in Australia [12]. Queensland needs to approve around 4,100 new dwellings per month to meet its share of the National Housing Accord target. In March 2025, the state approved 3,116 — a shortfall of nearly 1,000 for that month [1].
CBRE estimates Brisbane apartment delivery will average around 4,600 per year between 2025 and 2030, against annual demand of approximately 16,000 units [13]. The supply gap is widening, not closing.
Brisbane construction costs are forecast to rise by around 5% in 2026 (5.5% on the Gold Coast), according to Rider Levett Bucknall [7]. Standard residential builds now run roughly $3,500–$4,500 per square metre, with luxury and Olympic-linked projects pushing past $12,000 per square metre [7].
Expert commentary
Rhys Southern, Founder at RJ Fencing Brisbane, commented:
“What makes Queensland’s situation distinct is the compounding effect. You have a roughly 9% productivity decline over the past eight years, a projected 50,000-worker shortfall peaking as the Olympic build ramps up, and a rental market that is already among the tightest in the country. Every month of delay on a residential build means more families stuck in an undersupplied rental market, often paying elevated rents. The numbers are stark — we could have built around 77,000 more homes had productivity simply held steady.”
Notes on methodology
ABS completion times are state-level averages and do not capture variation between metro and regional areas. Workforce shortfall projections from Infrastructure Australia and Construction Skills Queensland are modelled estimates based on pipeline forecasts, rather than observed headcounts. The QPC’s working days comparison uses data from Queensland and Victoria — not all states were included. Construction cost figures reflect typical ranges and can vary by project type, location, and builder.
Sources
[1]. Australian Bureau of Statistics, Building Activity, Australia, September 2025 — https://www.abs.gov.au/statistics/industry/building-and-construction/building-activity-australia/latest-release
[2]. Australian Bureau of Statistics, Average Dwelling Completion Times — https://www.abs.gov.au/articles/average-dwelling-completion-times
[3]. Infrastructure Australia, 2025 Infrastructure Market Capacity Report, November 2025 — https://www.infrastructureaustralia.gov.au/publications/2025-infrastructure-market-capacity-report
[4]. Queensland Productivity Commission, Opportunities to Improve Productivity of the Construction Industry (Final Report), January 2026 — https://qpc.qld.gov.au/content/inquiries/construction-productivity.html
[5]. Construction Skills Queensland / QMCA, 2025 QMPP Findings — https://qmca.com.au/2025-qmpp-findings/
[6]. Queensland Building and Construction Commission (QBCC), Annual Report 2024–25 — https://www.qbcc.qld.gov.au/resources/corporate-publication/qbcc-annual-report-2024-2025
[7]. Rider Levett Bucknall, Construction Market Intelligence (Q4 2025 Update) — https://www.rlb.com/europe/insight/construction-market-intelligence-uk-edition-q4-2025/
[8]. Master Builders Australia, Build Times for New Homes in 2023–24 (Data Pack), November 2024 — https://masterbuilders.com.au/wp-content/uploads/2024/11/241104_DataPack-Build-Times-for-New-Homes-in-2023-24.pdf
[9]. Forward Path Advisory, Building Company Insolvencies in Australia, May 2023 to May 2025 — https://www.forwardpathadvisory.com.au/2025/05/30/building-company-insolvencies-in-australia-may-2023-to-may-2025/
[10]. Australian Institute of Credit Management (AICM), Construction Insolvencies Hit Decade-High, 2024 — https://www.aicm.com.au/news-item/16917/construction-insolvencies-hit-decade-high-in-2024
[11]. Queensland Government, 2032 Delivery Plan — https://www.delivering2032.com.au/2032-delivery-plan
[12]. SQM Research / REIQ, Brisbane Rental Vacancy Data, January 2026 — https://sqmresearch.com.au/graph_vacancy.php
[13]. CBRE, Australia Apartment Market Outlook / Shortage Forecast, 2025 — https://www.cbre.com.au/insights
[14]. Queensland Treasury, Construction Productivity Insights / Reports, 2025 — https://www.treasury.qld.gov.au/newsroom/interim-report-reveals-drop-in-construction-productivity/